
I have a recurring fantasy. My fantasy is of working at some office job during the 90’s, sitting at a desk with a computer running MS-DOS, doing business stuff with business software. Maybe I’m one of those guys who works at those cubicles you see at the car dealership, crunching numbers and tabulating data into spreadsheets while the ever-present “new car” smell lingers in the air. I know, weird fantasy. Also not something I would particularly enjoy if it actually happened in real life. But since I’m never going to be able to time-travel to the 90’s and get a desk job using vintage business software, it’s a moot point anyway. I just like seeing information when it’s all organized – tables, bar charts, agenda planners, hierarchal graphs – it’s like a fetish of mine. And when you put it in a blue-screen MDI typical of MS-DOS software, it’s simply orgasmic. So I’m going to play pretend like the man-child I am and imagine that I’m a grown-up with a respectable job (I know, probably never going to happen realistically) by playing around with some old Microsoft warez. In this case I’m running Microsoft Works 3.0 on MS-DOS.
After popping the floppy in my (virtual) drive I ran the SETUP program. Just the usual stuff like selecting the installation location, type of display, etc. There were a number of floppy images I had to go through.

Once installed, there’s a very handy tutorial you can use to learn the software. It covers Microsoft Works in-depth and is divided into sections and subsections. Here’s a sample of the section covering the word processor:

The main thing I was interested in was how to make spreadsheets and charts, so I took an in-depth look at that tutorial.


I also thought it would be neat to be able to insert charts into a word processing document, so I watched that tutorial as well.


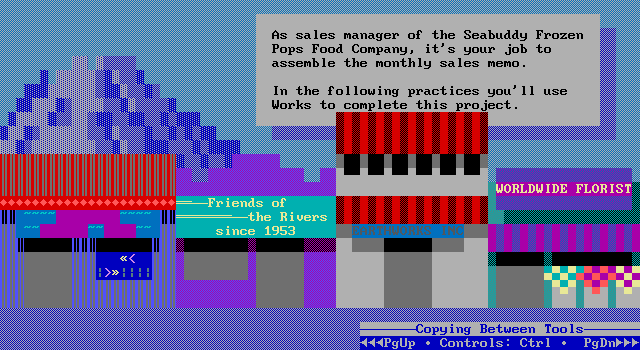
The tutorial program has some pretty creative ANSI art too…
Once I was finished with the tutorial and knew how to use all the basic functionality in Works, I fired up the main program and started working with some files. Microsoft Works has four sub-programs: a word processor, a spreadsheet, a database manager, and a communications program. Of course I can only use three of these, since I don’t have a virtual COM interface with which I can make use of the communications app, not to mention there would be no one at the other end to talk to even if I did. I don’t know, maybe it is possible to do with VirtualBox. I already know how to map the COM interface in Windows 7 to the USB port, so if I could map the COM port of the VM to Windows 7’s virtual COM interface I might be able to actually use that software. Maybe I could get some tech-savvy friends together and we could all have secret meetings over a COM link interface that only we know how to use. Wouldn’t that be something?
So I wanted to make a spreadsheet, and I wanted it to be something that actually has applications to my life. Remember, I’m playing office here, so the stuff I do with this program should actually be useful from a business perspective. Otherwise I’m just pressing random buttons, so to speak. I thought maybe I should do a spreadsheet of my purchases for the month, since I’ve been doing that in OpenOffice for some time now. But then I realized I wouldn’t be able to make much of a chart from that, at least not anything that would provide much insight. Then I had an idea. Why don’t I chart my analytics data from my WordPress site and try to find patterns based on what articles are trending upward in the search engines? I can get a lot of insight into what sort of topics people are searching that way, leading to more informed decisions when it comes to deciding what my next article should be about.
I collected the weekly page-view data from my top articles for the past four weeks and organized them into a spreadsheet. I know, my hit counts are dismal, probably because I haven’t been updating enough lately.

Once I was finished tabulating my analytics data, I made a chart and set the format to 100% bar. This means that each week has bars for the first six articles stacked on top of each other, and then stretched or compacted so that the total heights for all weeks are the same. This allows me to see the proportions of hit counts relative to other weeks, which allows me to see which articles are trending upward, which articles are trending downward, and which articles are relatively constant. This stacked bar chart can be formatted for either a color printer or a black-and-white printer. And unlike how they are shown in the tutorial, the charts are in fact displayed in graphics mode.


Once I was done with this, I created a word processing document and copied and pasted both the spreadsheet and the chart onto it. Unfortunately since I hadn’t installed any printers, the chart wouldn’t display in the print preview.

In addition to the four main programs, Microsoft Works also has a few smaller utilities that make it useful not just as an office suite but also as a personal information manager. These utilities include a calculator, a calendar, and an alarm clock. I haven’t tried the last of these as I’m not sure how an alarm clock would work in DOS since I haven’t installed any sound drivers yet. Maybe there’s a message that pops up on the screen.
I did make use of the calendar though. It’s pretty nifty as an agenda planner, allowing you to schedule events and appointments throughout the day specifying both the start time and the duration and displaying them graphically. It even allows you to stack appointments on top of each other, though this behavior is discouraged.

Yeah, you just got a glimpse into the private life of Michael Warren here. Take from it what you will. 😛
Works also has a nifty utility for controlling the settings, which allows for some pretty fine-grained control of the program. It lets you change the color scheme as well as change the number of lines displayed and switch between text mode and graphics mode (as far as I can tell, the only difference between these two is whether the mouse appears as a block or a pointer).

Here’s one of the alternative colorschemes, which I’m pretty sure is supposed to be reminiscent of VMS:

Here’s works with 43 lines in monochrome mode with the windows manually tiled and the blue and red channels on my monitor turned off for an authentic green-screen terminal look:

Despite how cool these other colorschemes look, I still prefer the default. The blue is just soothing.
