
So due to the mainstream media overhyping the Coronavirus epidemic and treating it like the end of the world so they can get better ratings and make a ton of money by generating mass panic, virtually every business and facility across my country has shut down at least for the next few weeks (I say “my country” because most of my readers (if I still have them after so much absence) are outside the US, so yeah). Due to the mass quarantine that has taken place as of the last few days, I’m left with nothing to do except what I can find to entertain myself at home. And that means I’m spending most of my time on the Internet.
Let’s be real here: The Coronavirus epidemic isn’t really any different from any of the other epidemics we’ve been having every seven years or so since the dawn of time. Yet every time something like this happens, people think it’s literally the end of the world. But in a way, I’m glad all the dumb normies are losing their shit, because it gives me an opportunity to exploit the ensuing stock market crash by buying really cheap stocks that are guaranteed to go up as soon as the WHO declares the virus contained. Lots of people get filthy rich off recessions, and I intend to be one of those people. If you can keep a level head during a crisis and avoid the “end of the world” mentality, you can make a killing in business. I may only have a few hundred dollars to invest, but if I use it strategically, I could turn that few hundred dollars into a few thousand dollars. Overall, with everyone else dropping out of the stock market like flies, it’s a great time to get into Wall Street speculation as someone with absolutely no experience. First rule of investing is that it’s a zero-sum game, so always do the opposite of what everyone else is doing if you want to beat them.
My early forays into the stock market have been a mixed bag. I’ve had a few successes here and there, but I’ve also lost a non-negligable sum of money (I’d say about $10). I’m willing to take that loss as I’m learning the ropes of investing, learning from my mistakes and formulating a game plan I can use to get higher returns on my investments in the future. Here’s one of my less successful investments:
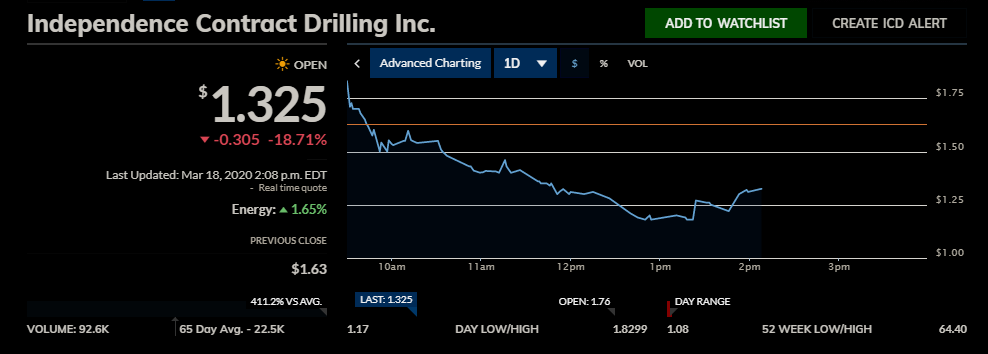
I bought 20 shares of this company just before its stock price took a nose dive and lost an additional 12% of its value. I then read in the Wall Street Journal that the oil industry is essentially in the toilet right now due not just to the price war between Russia and Saudi Arabia but also the vast drop in transportation due to Coronavirus as well as a global move away from fossil fuels. So yeah, basically I made the dumbest stock pick imaginable. It was obvious this stock was going to keep going down and the company would probably go bankrupt before the recession was over causing my entire investment to evaporate, so I bailed out and dumped my shares before they could get any lower. That investment cost me a good $4.80 total. Probably better to stick with the travel industry and brick-and-mortar businesses if I want something dirt-cheap that will probably bounce back. But I learned something from this whole ordeal: Always make sure to research the industry you’re investing in prior to investing in it.
Ah yes, research, one of my favorite activities in the whole world. I love combing the Internet, or the library’s reference section, looking for answers, and seeing what kind of esoteric information I can find. Lately I’ve been doing a lot of research to try to position myself so that I can best profit off of this latest media-manufactured crisis. One of the things I’ve been doing is looking at trends with the Coronavirus, as well as its older and arguably far less deadly cousin, SARS, to determine how long the outbreak will last, how far-reaching the economic impact will be, and when the economy can be expected to bounce back. I’m doing this mainly so that I can have an idea of what kind of time horizon I have for investing, and so that I can see the indicators of when the stock market is going to hit rock-bottom, signifying the ideal time to invest.
I think we can best understand how the Coronavirus recession is going to impact the economy in the long run by going back nearly two decades to the SARS outbreak of 2003. Of course the scale of SARS was much smaller than that of Coronavirus, but I believe we can extrapolate a lot of what happened with SARS to predict what will happen with Coronavirus in the months to come. Both SARS and Coronavirus are part of the same strain of viruses, collectively called COVID, and so they can be expected to behave fairly similarly. We can also look at comparisons between what’s going on now versus what happened in the early weeks of the SARS epidemic to gauge how Coronavirus’s impact will differ from that of its earlier variant.
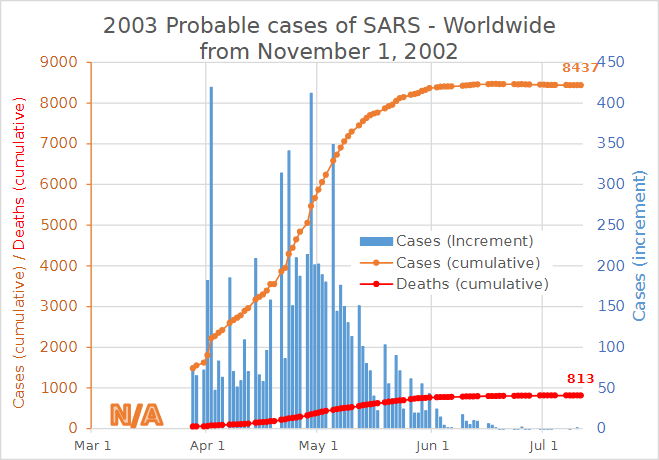
Below is a graph of SARS cases I pulled off Wikipedia. As you can see, the daily number of new cases follows a bell curve, with the cumulative cases forming a sigmoid curve.
Below we can see how the SARS outbreak impacted the economy of China. Since China is a major player in the world economy, we can extrapolate how SARS affected the world economy from this.

There are a few valuable pieces of information we can glean from the above graph. First, the beginning of the bearish market coincided with the WHO declaring the virus a global pandemic. Using this information, I predicted that the economy would tank as soon as the WHO did the same thing with Coronavirus, and I was right. So I think studying SARS is indeed valuable in understanding the future economic impact of Coronavirus.
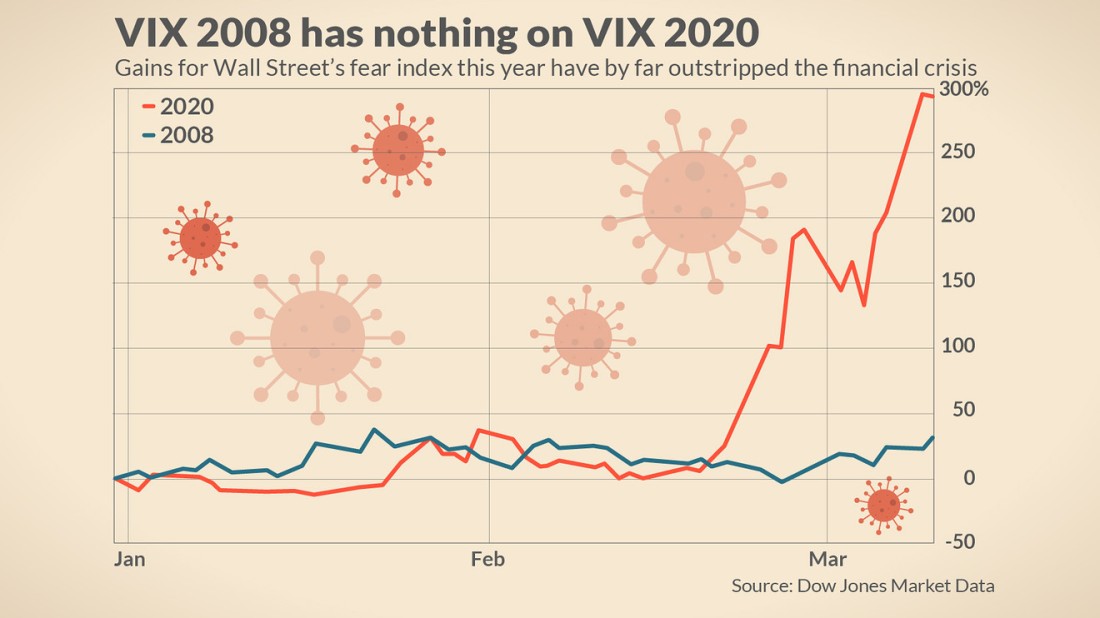
The second valuable piece of information is that the market reached its lowest point when the global number of SARS cases was at its highest point, and then rebounded as soon as the WHO declared the virus contained. The reason the WHO declarations had such an impact is because stock market crashes and surges are very much a product of fear and optimism, respectively. In fact Wall Street has a term for this – they call it the “fear index” – and it’s illustrated in the infographic below:
So basically, anyone who wants to profit off this recession in the long run will have a vested interest in being able to predict when the virus is going to start slowing down, when it’s going to reach its peak, and when the WHO is going to declare the crisis over, thus inevitably ending the recession. I’ve tabulated some data from various sources (well, mostly just this one source) and used some statistical analysis and some calculus, eventually automating the data analysis process with C.
I’ve been watching two graphs in particular on that page:


If you’re wondering what’s with the “black like mah soul” colorscheme, it’s because I’m using Dark Reader. Makes me feel like a 1337 h4xx0r no matter what I’m doing. 😛
Both of these graphs are useful in their own right, but for slightly different reasons. The first allows us to model the outbreak in China particularly well, giving us an idea of how the outbreak has been contained in that part of the world and how the rest of the world may follow suit. The second gives us insight into the actual spread of the pandemic. Since it’s largely contained within China, excluding the Chinese mainland allows us to see the exponential behavior of the spread more clearly (although we can still see a less pronounced exponential curve in the first figure).
First of all, if you look closely at the left-hand side of the first graph, you can see that it does indeed follow a sigmoid curve, just like the cumulative curve characteristic of SARS. This is, again, because the virus has been successfully contained in China. In fact the point of inflection shows us the exact point in time that the virus was successfully contained. In calculus terms, the cumulative function is the definite integral of the function representing the number of new cases, with the lower limit of the integral being the point when the first person contracted the disease. The point of inflection of the cumulative function is the centroid of the sigmoid curve, and it represents the point where the virus started to taper off. Here the first derivative stops increasing and starts decreasing and the second derivative is zero. Theoretically the third derivative will go from positive to negative sometime before the second derivative does, so it can be used as an early predictor of the behavior of the function (though as you will see later, the function cannot be exactly modeled as an exponential or sigmoid function and the third derivative tends to jump around quite a bit).
Below is a rough drawing of how these four functions would look. Here I have modeled the sigmoid curve as the hyperbolic tangent function.
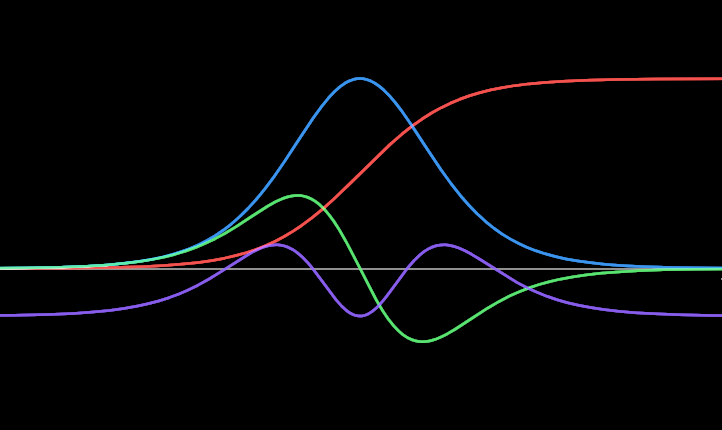
Here Red represents the cumulative function, Blue represents the first derivative, Green represents the second derivative, and Violet represents the third derivative. As you can see, the third derivative hits zero sometime before the second derivative does, so it is an accurate early predictor of the inflection point. It is at this point that I think we should start buying up penny stocks like those in the cruise and airline industries. Though I already have a few shares of Carnival Corp bought up just in case the stock price never satisfactorily bottoms out (though it most definitely will, it’s more just for my own peace of mind than anything else).
Going back to the sigmoid curve in the worldwide cases graph (ignoring the sudden jump due to cases being rediagnosed as Coronavirus), we can see that the inflection point occurred sometime in the middle of February. Indeed if we tabulate all these data points, we get something like this:
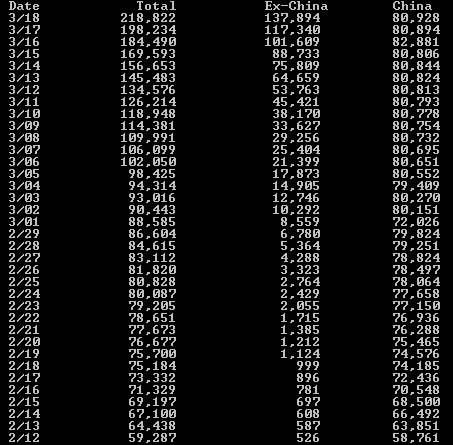
Notice how the rate of increase for Chinese cases is much sharper toward the bottom, and is basically level in the top half of the table. In fact sometimes the number of Chinese cases actually goes down. I was baffled by this at first, but then I realized the number of Chinese cases is probably being offset by people entering and leaving mainland China. If it’s not that then I don’t know what it is. I double-checked my calculations to make sure I didn’t enter any of the numbers wrong, so what you see is 100% accurate.
So let’s go back to mid-February and see what China was doing to combat the Coronavirus at that time. After doing some searching on DuckDuckGo I pulled up this article from Business Insider. Unfortunately it’s using intrusive anti-adblock technology which completely prevents you from viewing the page unless you either castrate your browser’s adblock features or pay them a monthly fee, but I got around it by opening it in Lynx. Here’s an excerpt:
In China, where the novel coronavirus originated last year, cases of COVID-19 have steadily declined since peaking in mid-February and are now zeroing out. But other countries shouldn’t expect their rates of infection to decline quickly, since China took some extreme measures to contain the virus that other countries haven’t, shouldn’t, or won’t.
…
China built new hospitals in a rush, with workers toiling night and day to get them done.
…
China walled off entire hospital wards to contain the virus.
…
The country postponed non-urgent medical care, and moved any doctor’s visits online. Not all patients were given the critical care they needed during the outbreak, though.
…
When staying home, it’s been relatively easy for Chinese people to get extra food and supplies.
…
The country may punish people who don’t disclose that they’ve been to coronavirus hotspots around the world, with a social credit score downgrade.
So basically, China isn’t exactly an ideal microcosm for what will happen with the rest of the world. However, it’s the closest thing we have to a microcosm for how much the Coronavirus will spread throughout the world population. Given that nationwide quarantines are becoming a lot more aggressive in the last week or so, the Coronavirus epidemic may be over sooner than we think. We just have to watch those numbers, which brings me to the data analysis I’ve been doing on the cumulative cases function and it’s derivatives.
Basically I calculate the derivatives by simply subtracting the previous value from the current value. So for n data points for the function, we get n-1 data points for the derivative function. We can repeat this process for the derivative, obtaining n-2 data points for the second derivative, and n-3 data points for the third derivative. The following C program approximates the derivative functions using this method. Note that I’m using the Windows C syntax (see my previous article on Windows C syntax) since I intend to run this in the command prompt.
 1 #include <stdio.h>
 2 #include <stdlib.h>
 3 #include <string.h>
 4 #include <errno.h>
 5 #include <ctype.h>
 6
 7 void main( int argc, char **argv ){
 8     FILE *fp;           // File pointer
 9     char buf[20];       // Buffer for reading the file
10     int *derivatives[4];// Derivative data points
11     int lines = 0;      // Number of data points in each array
12     int i, j;           // Loop counters
13     int len;            // String length
14     // Open file and handle any errors:
15     if( !(fp = fopen( argv[1], "r" )) ){
16         fprintf( stderr, "%s: %s: %s\n", argv[0], argv[1], strerror( errno ) );
17         exit( errno );
18     }
19     // Count lines in file:
20     while( fgetc( fp ) != EOF ){
21         fgets( buf, 20, fp );
22         lines++;
23     }
24     // Set up arrays of data points:
25     for( i = 0; i < 4; i++ ){
26         derivatives[i] = (int *) malloc( sizeof( int ) * lines-- );
27     }
28     lines += 3;
29     rewind( fp );
30     for( i = 0; i < lines; i++ ){
31         fgets( buf, 20, fp );
32         len = strlen( buf );
33         for( j = 0; j < len; j++ ){
34             // Strip control characters so they don't
35             // interfere with atoi():
36             if( !isdigit( buf[j] ) ) buf[j] = '\0';
37         }
38         derivatives[0][i] = atoi( buf );
39     }
40     // Outer loop loops through array of arrays
41     for( i = 1; i < 4; i++ ){
42         // Inner loop loops through individual arrays
43         lines--;
44         for( j = 0; j < lines; j++ ){
45             // Calculate derivatives:
46             derivatives[i][j] = derivatives[i-1][j] - derivatives[i-1][j+1];
47         }
48     }
49     // Drop last three data points because
50     // it makes programming easier.
51     for( i = 0; i < lines; i++ ){
52         for( j = 0; j < 4; j++ ){
53             printf( "%8d\t", derivatives[j][i] );
54         }
55         putchar( '\n' );
56     }
57     // Free up memory:
58     for( i = 0; i < 3; i++ ){
59         free( derivatives[i] );
60     }
61     fclose( fp );
62 }
I typed this program up in Open Watcom, and surprisingly enough, it actually ran perfectly the first time. I did a flowchart for it too (I’m starting to do flowcharts for any nontrivial programs I write, which is a habit I learned from my Java class last semester).

I know the flow chart is kind of sloppily done, but it still makes it a lot easier to program without making really stupid mistakes. I attribute the fact that the program ran correctly the first time to me making a flowchart beforehand. I made it using the yEd graph editor.
Putting all the data points from the second Coronavirus data set (excluding mainland China) into a text file and running this program on that file generates the following output:

As we can see, it’s far too early to tell when this epidemic will start slowing down. Currently it’s actually accelerating, and I assume it will continue doing so for some time. Also, as I mentioned previously, the third derivative is all over the place. But when it gets to the point where it is consistently negative or close to zero, then we know we are approaching the inflection point of the Coronavirus curve, the height of the infection, and the rock-bottom point of the stock market. That’s when it’s time to buy, buy, buy. Yeah, I’m gonna get rich, and I encourage anyone reading this to do the same thing. (Obviously I’m not worried about other people beating me to the punch because not enough people read my blog for their stock purchases to really impact the market. So yeah, I’ll openly share my research because I think it’s interesting and I’m passionate about it.)
So in closing, this is, like I said, a matter of keeping your shit together when everyone else is losing theirs. Patrick Bet David of YouTube fame once said that the “end of the world” mentality is what keeps many people from achieving wealth during a crisis. So stay cool, calm, and logical while the rest of the world burns. Soon it will all be back to normal, and people like me who spent their excess cash on stock market speculation instead of toilet paper will win in the end.
Overall I’m not even slightly worried about Coronavirus. It’s not the end of the world as we know it, not even close. I see it as just part of human evolution: Every few years a new plague comes along and kills off all the weakest members of the population, thus cleaning out the gene pool and ensuring the continuing fitness of the human race through survival of the fittest. I know that sounds mean to the people who are dying, but it’s the objective reality of what’s going on. We’ve had pandemics that were far worse than this one (Spanish influenza anyone?) and we pulled through, the economy pulled through, everything was fine; and everything will be fine six months from now as well. Yeah, some people are going to die, but thousands of people die every day anyway. It’s nothing. But boy is it fun to sit here and watch the shit-show from the sidelines, while making a tidy profit to boot.

Good luck with stoch market. I think the same 🙂
LikeLike